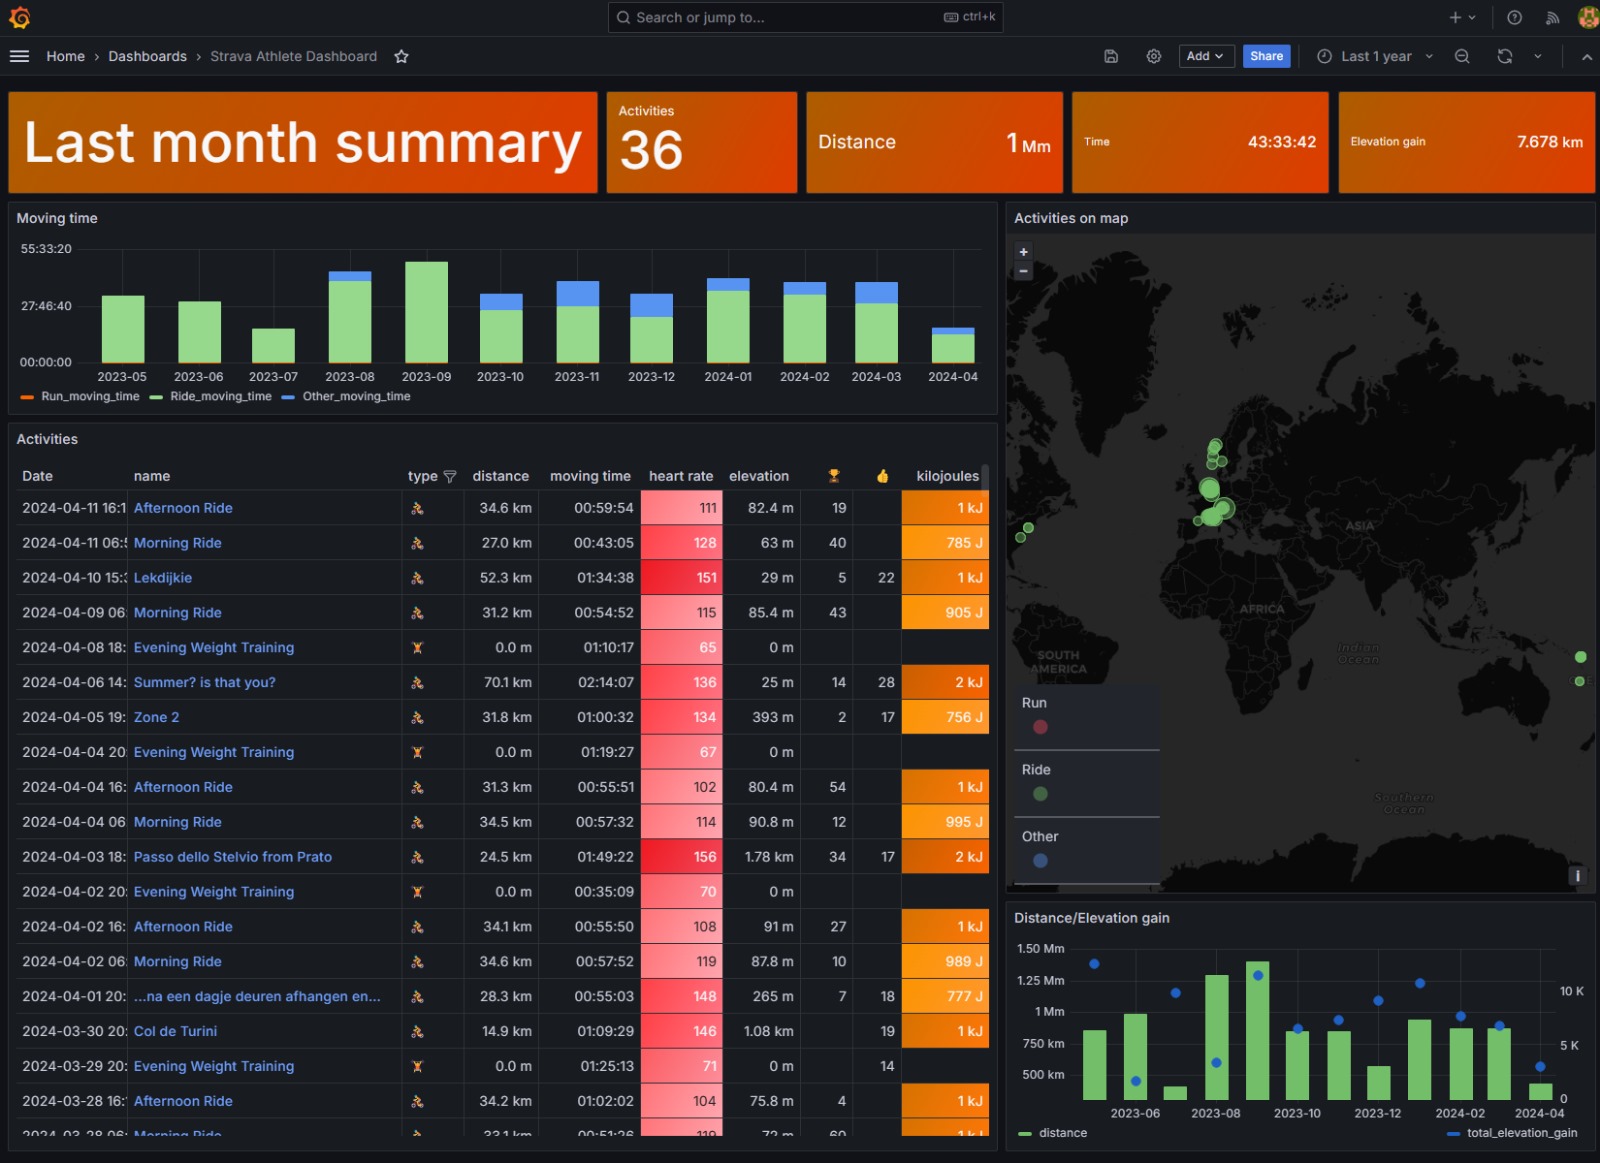
This is for monitoring inclined cyclists and runners that also happen to use Strava for activity logging (who is not!?). This post takes you through connecting Grafana to Strava.
There is an well maintained data source for Grafana available (here). This data source connects to the Strava API and retrieves information about your activities. The information is then available to display in Grafana dashboards.
Step 1: Installing the Grafana data source
Install the Grafana data source for Strava manually…
grafana-cli plugins install grafana-strava-datasource
…or by Ansible:
- name: Install grafana plugins
  shell: grafana-cli plugins install "{{ item.plugin }}"
  loop:
    - { plugin: alexanderzobnin-zabbix-app }
    - { plugin: grafana-worldmap-panel }
    - { plugin: hamedkarbasi93-kafka-datasource }
    - { plugin: grafana-strava-datasource }
When you are using a self hosted Grafana instance, you also need to set the following in grafana.ini:
[feature_toggles]
externalServiceAccounts = true
Step 1: Creating an API Application
Authenticate to Strava and go to: https://www.strava.com/settings/api
Fill out the following fields:
- Application Name – A logical name
- Category – I chose Performance Analysis
- Authorization Callback Domain – localhost
After you created the App the following information is available. Client ID and the Client Secret is needed for the Grafana data source.
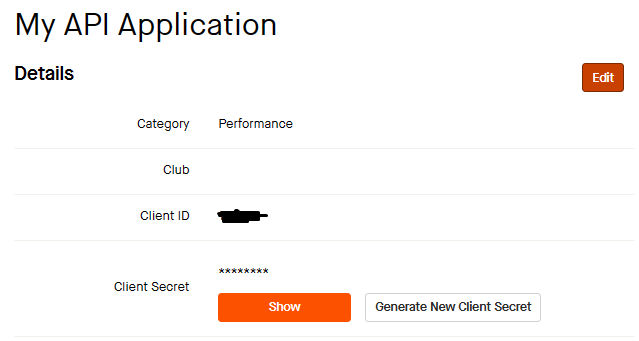
Step 2: Configuring the Grafana data source
Open the Grafana data source in Grafana and configure the Client ID and Client Secret. After that click “Connect with Strava” and “Save & Test”.
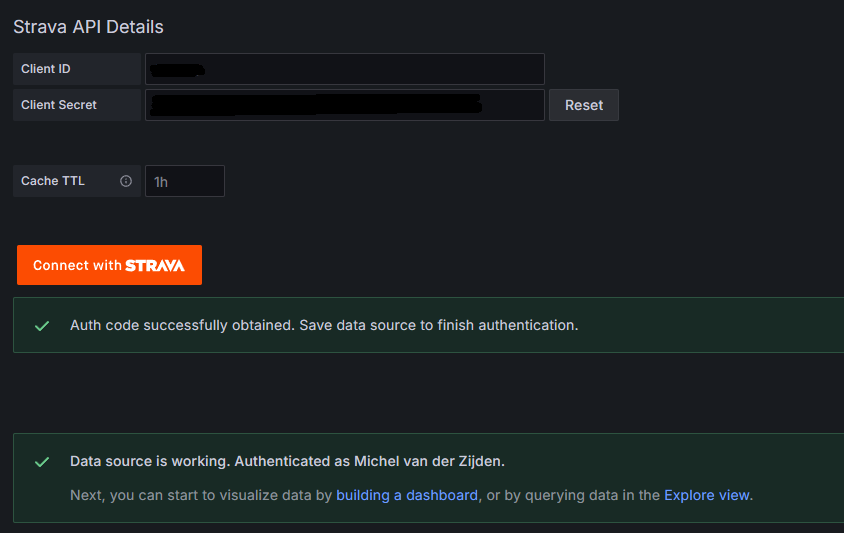
Step 3: Import the default Dashboards
Open the tab “Dashboards” from the data source pane, and import the dashboards:
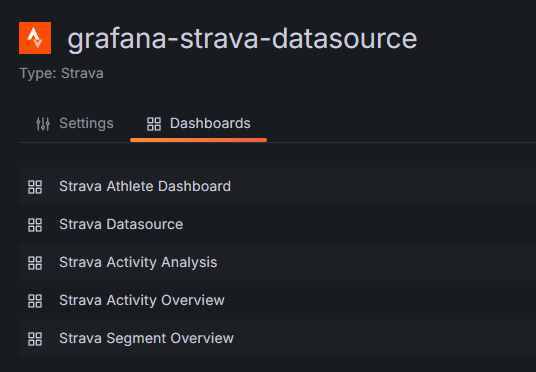
Step 4: Open a Dashboard
Navigate to the Grafana dashboards overview and experience the awesomeness of Strava data in Grafana 😉
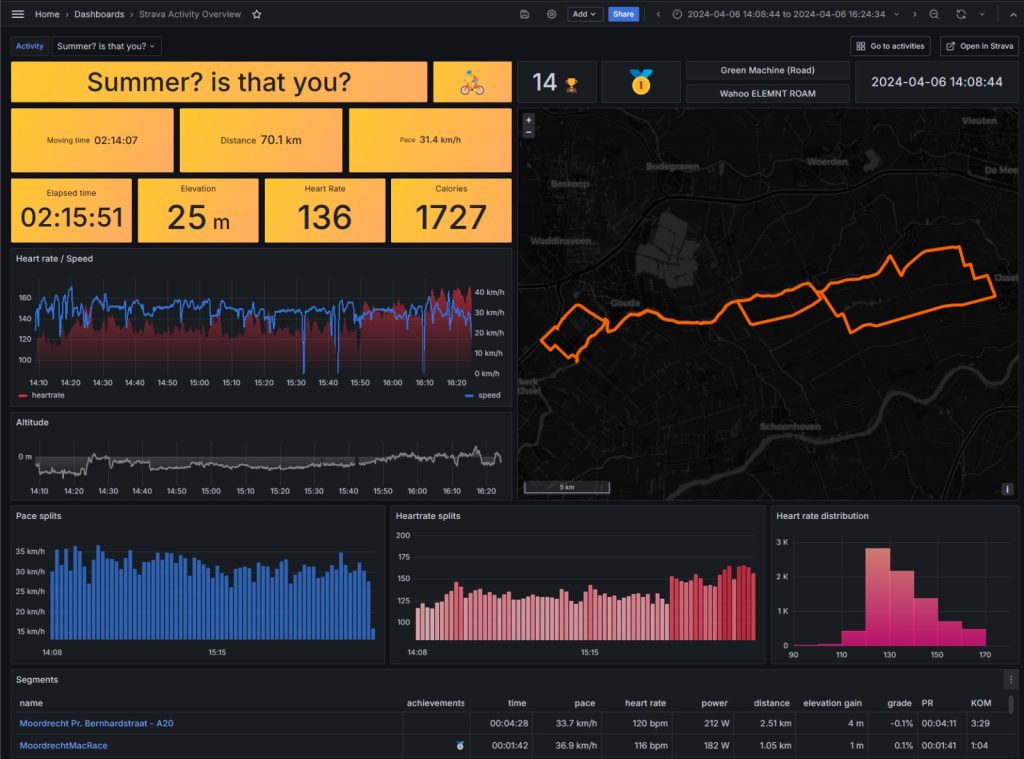
Step 5: Create your own dashboards
While the default dashboards are nice, it is of course possible to create your own dashboards for displaying your achievements 🙂
API Rate Limits
Strava’s API rate limits are not very generous, so you will run into messages that you exceeded them sooner than later. Currently it is allowed to do 100 requests every 15 minutes and 1,000 daily.
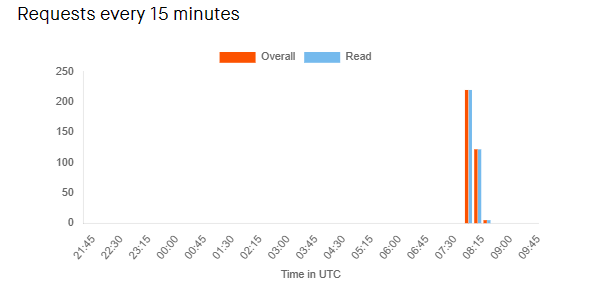
The daily limit seems to be reasonable, the 15 minute rate can be a little annoying 🙂 None the less another great way to show off Grafana’s dashboarding capabilities.


